
The Miller is Great Fantasy Football League is a traditional fantasy league with boring rules. It could, however, be an interesting league with unique rules. This page examines the possibility of a two-tiered league with promotion and relegation.
 |
 |
 |
 |
Regular Standings for Week 16
| # | Team | W-L-T | PTS | Optimal PTS | Week 16 W-L-T | Week 16 PTS | Week 16 Optimal PTS | |
|---|---|---|---|---|---|---|---|---|
| Premier Division | ||||||||
| 1 |  |
Vulcan Mind-melds | 100-76-0 | 1902.7 | 2030.8 | 4-7-0 | 111.9 | 125.8 |
| 2 |  |
Honolulu Blew It | 99-77-0 | 1880.2 | 2198.2 | 6-5-0 | 119.9 | 131.6 |
| 3 |  |
Portland Pat Tillman | 94-82-0 | 1806.0 | 1981.4 | 3-8-0 | 108.1 | 120.8 |
| 4 |  |
NY WH Coons | 80-96-0 | 1758.6 | 2051.5 | 9-2-0 | 128.6 | 138.5 |
| 5 |  |
OK City Bombers | 74-102-0 | 1666.7 | 1941.0 | 0-11-0 | 70.8 | 110.7 |
| 6 |  |
DCFC | 65-111-0 | 1616.5 | 1915.0 | 5-6-0 | 112.6 | 150.8 |
| Championship Division | ||||||||
| 7 |  |
Springfield Isotopes | 118-58-0 | 1963.8 | 2222.2 | 11-0-0 | 162.6 | 186.6 |
| 8 |  |
Team Harleton | 115-61-0 | 1938.4 | 2157.9 | 10-1-0 | 160.0 | 176.5 |
| 9 |  |
Office Linebackers | 103-73-0 | 1884.5 | 2028.0 | 8-3-0 | 123.7 | 149.3 |
| 10 |  |
Seattle Lawful Evils | 88-88-0 | 1735.9 | 1904.4 | 1-10-0 | 80.2 | 94.3 |
| 11 |  |
Palestinian Chicken | 68-108-0 | 1652.6 | 1886.0 | 2-9-0 | 88.4 | 123.3 |
| 12 |  |
51st Statesmen | 52-124-0 | 1507.3 | 1666.5 | 7-4-0 | 121.2 | 128.0 |
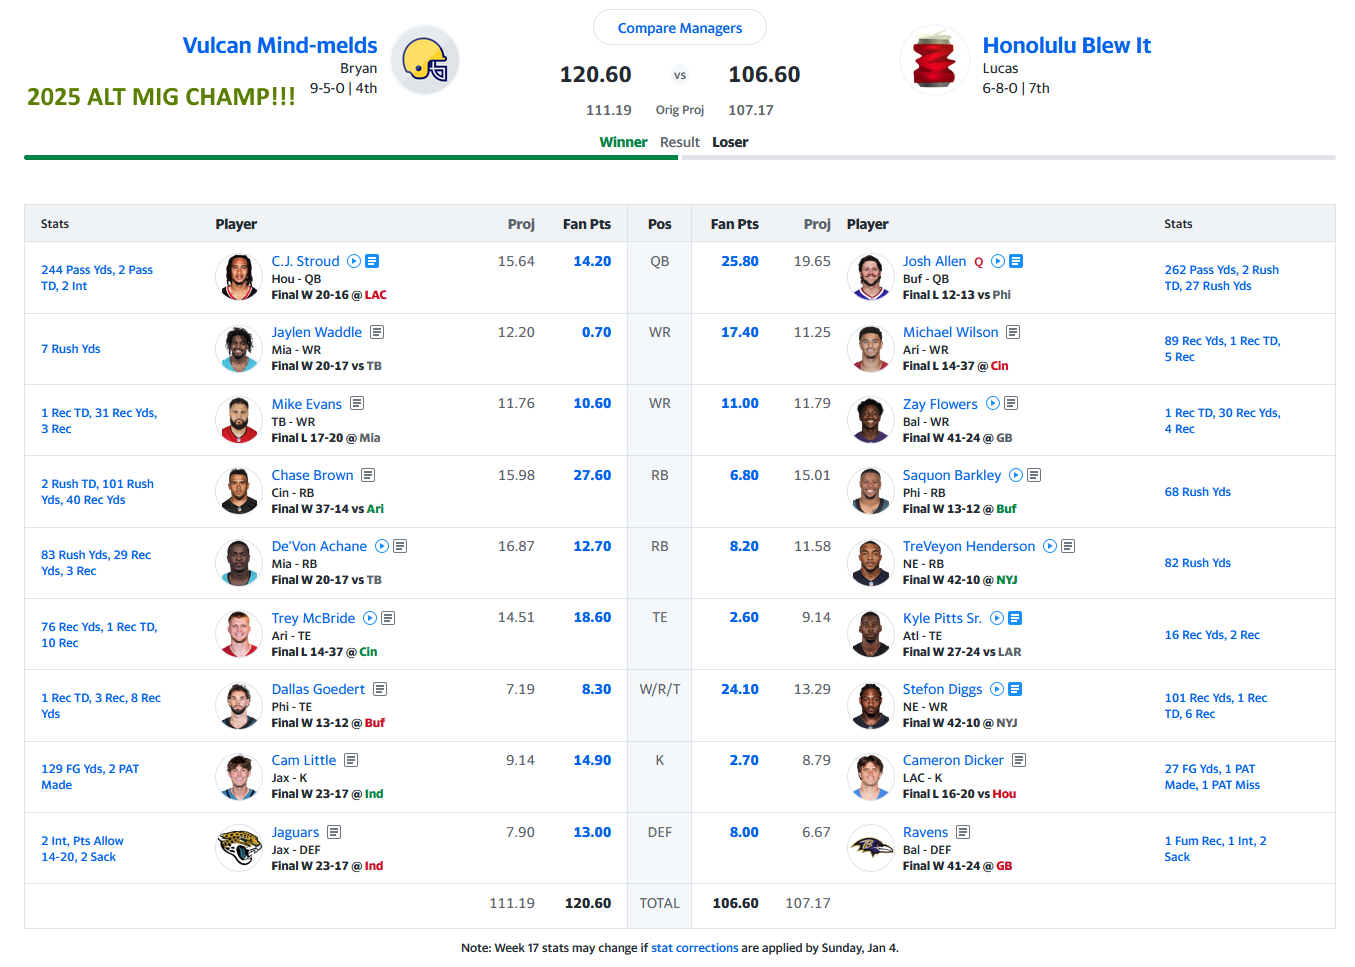
- Premier Division Championship Game (Vulcan Mind-melds v Honolulu Blew It)
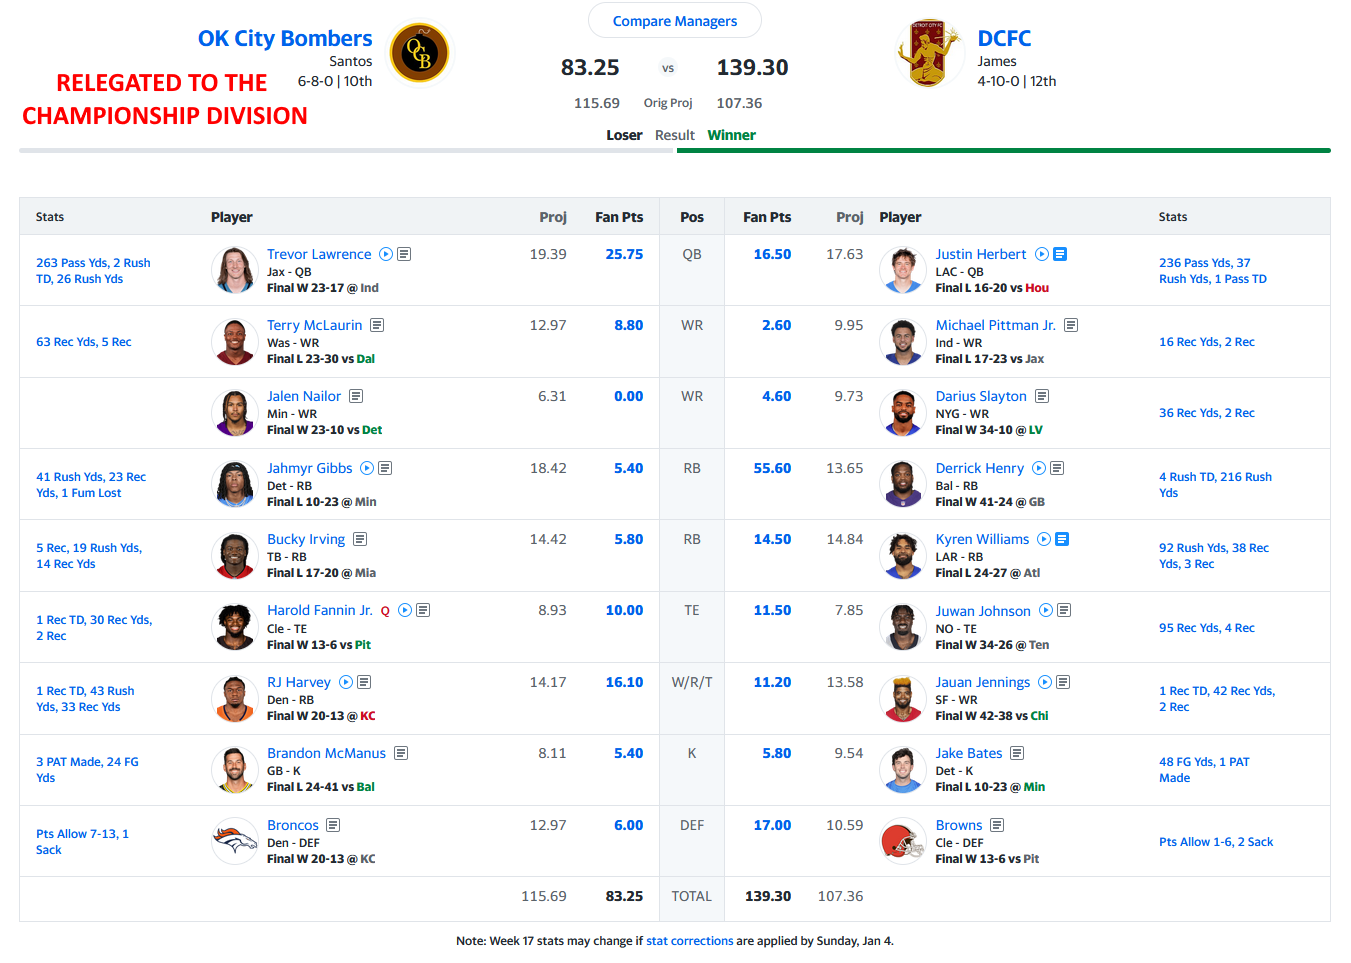
- Premier Division Relegation Game (Oklahoma City Bombers v DCFC)
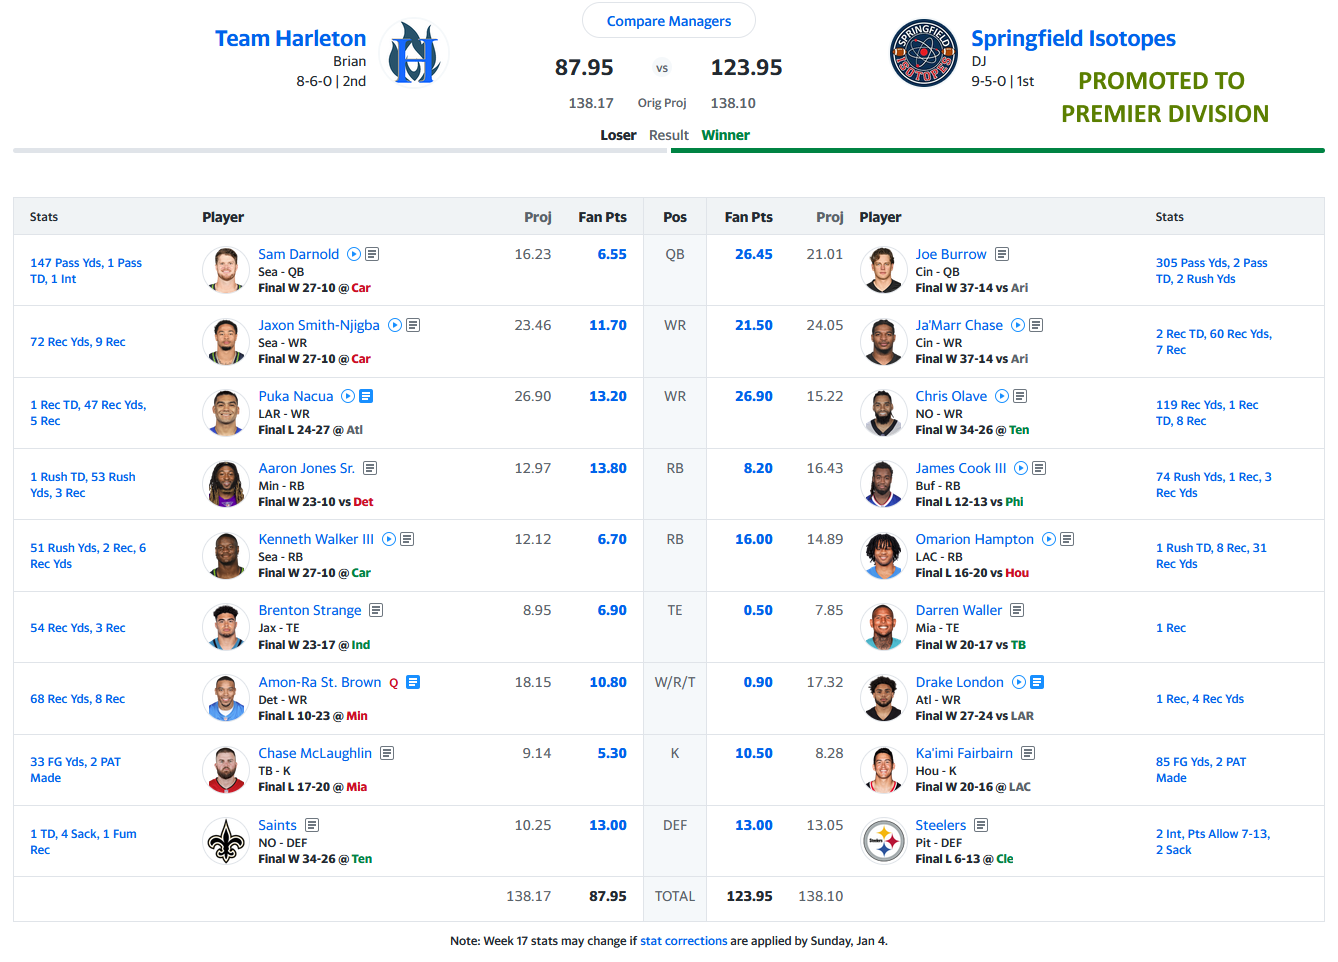
- Championship Division Promotion Game (Springfield Isotopes v Team Harleton)
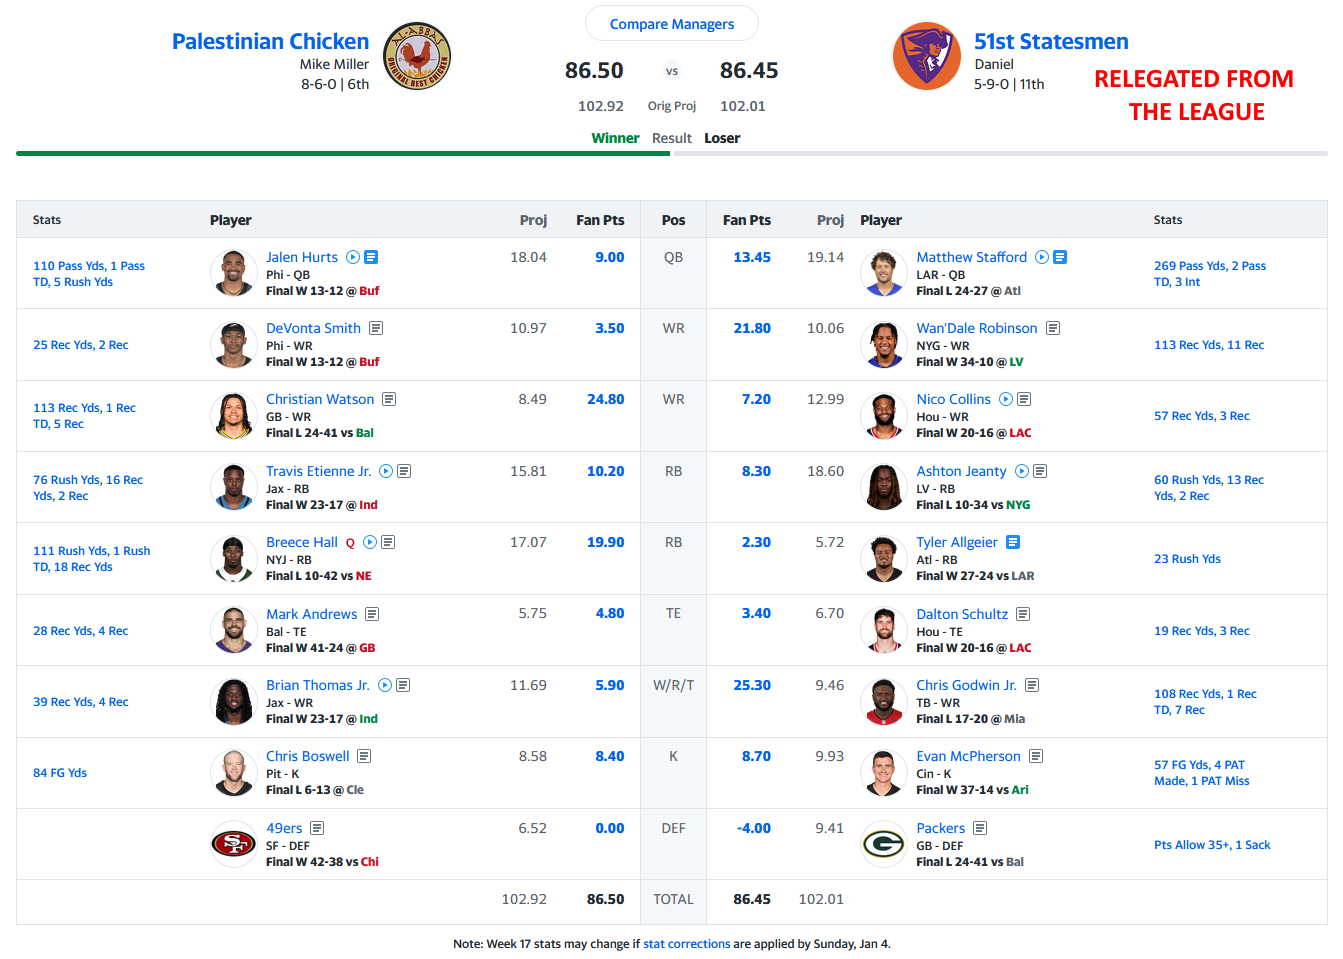
- League Relegation Game (Palestinian Chicken v 51st Statesman)
The most important standings are the ones to the left, which present the formal promotion/relegation model standings for this alternate league. Each week, every team's score is compared to every other team's score. This produces their record.
Only the top-6 teams each year are eligible to compete for the title. This group is called the "Premier" division. After playing all weeks in the season, the top two teams in the Premier division compete for the title; the bottom two teams compete to stay in the Premier division with the loser of this game being relegated to the "Championship" division.
The top two teams in the Championship division compete for the opportunity to be promoted to the Premier division; the bottom two teams compete to avoid the league punishments for the year.
Optimal Points Standings for Week 17
Optimal v. Regular
| # | Team | W-L-T | PTS | Optimal PTS | |
|---|---|---|---|---|---|
| Premier Division | |||||
| 1 | |
Honolulu Blew It | 135-52-0 | 1986.8 | 2321.6 |
| 2 | |
Vulcan Mind-melds | 125-62-0 | 2023.3 | 2167.8 |
| 3 | |
Portland Pat Tillman | 124-62-1 | 1922.0 | 2104.2 |
| 4 | |
NY WH Coons | 122-65-0 | 1841.4 | 2147.7 |
| 5 | |
DCFC | 116-71-0 | 1755.8 | 2064.7 |
| 6 | |
OK City Bombers | 112-75-0 | 1749.9 | 2031.5 |
| Championship Division | |||||
| 7 | |
Springfield Isotopes | 152-35-0 | 2087.8 | 2366.3 |
| 8 | |
Team Harleton | 137-50-0 | 2026.4 | 2248.8 |
| 9 | |
Office Linebackers | 122-65-0 | 2008.2 | 2169.0 |
| 10 | |
Seattle Lawful Evils | 112-75-0 | 1845.4 | 2022.7 |
| 11 | |
Palestinian Chicken | 111-76-0 | 1739.1 | 2005.2 |
| 12 | |
51st Statesmen | 76-111-0 | 1593.8 | 1753.9 |
Optimal v. Optimal
| # | Team | W-L-T | PTS | Optimal PTS | |
|---|---|---|---|---|---|
| Premier Division | |||||
| 1 | |
Honolulu Blew It | 116-71-0 | 1986.8 | 2321.6 |
| 2 | |
Vulcan Mind-melds | 100-87-0 | 2023.3 | 2167.8 |
| 3 | |
DCFC | 96-91-0 | 1755.8 | 2064.7 |
| 4 | |
NY WH Coons | 95-91-1 | 1841.4 | 2147.7 |
| 5 | |
Portland Pat Tillman | 91-96-0 | 1922.0 | 2104.2 |
| 6 | |
OK City Bombers | 84-102-1 | 1749.9 | 2031.5 |
| Championship Division | |||||
| 7 | |
Springfield Isotopes | 126-60-1 | 2087.8 | 2366.3 |
| 8 | |
Team Harleton | 114-73-0 | 2026.4 | 2248.8 |
| 9 | |
Office Linebackers | 98-89-0 | 2008.2 | 2169.0 |
| 10 | |
Seattle Lawful Evils | 82-105-0 | 1845.4 | 2022.7 |
| 11 | |
Palestinian Chicken | 77-109-1 | 1739.1 | 2005.2 |
| 12 | |
51st Statesmen | 40-145-2 | 1593.8 | 1753.9 |
The two standings to the left show two different scenarios.
The left-most standings calculate the record for each team if their owner had selected their optimal lineup and competed against each team's regular lineup.
The right-most standings are for the competitive records for all teams if they selected their optimal weekly lineup.
Percentage of Optimal Performance
Week 17 Optimal Pct.
| # | Team | % of optimal | |
|---|---|---|---|
| 1 | |
51st Statesmen | 99.0% |
| 2 | |
Team Harleton | 96.8% |
| 3 | |
Portland Pat Tillman | 94.5% |
| 4 | |
DCFC | 93.1% |
| 5 | |
Seattle Lawful Evils | 92.6% |
| 6 | |
OK City Bombers | 91.9% |
| 7 | |
Vulcan Mind-melds | 88.0% |
| 8 | |
Office Linebackers | 87.7% |
| 9 | |
Honolulu Blew It | 86.4% |
| 10 | |
NY WH Coons | 86.1% |
| 11 | |
Springfield Isotopes | 86.1% |
| 12 | |
Palestinian Chicken | 72.6% |
Overall Optimal Pct.
| # | Team | % of optimal | |
|---|---|---|---|
| 1 | |
Vulcan Mind-melds | 93.3% |
| 2 | |
Office Linebackers | 92.6% |
| 3 | |
Portland Pat Tillman | 91.3% |
| 4 | |
Seattle Lawful Evils | 91.2% |
| 5 | |
51st Statesmen | 90.9% |
| 6 | |
Team Harleton | 90.1% |
| 7 | |
Springfield Isotopes | 88.2% |
| 8 | |
Palestinian Chicken | 86.7% |
| 9 | |
OK City Bombers | 86.1% |
| 10 | |
NY WH Coons | 85.7% |
| 11 | |
Honolulu Blew It | 85.6% |
| 12 | |
DCFC | 85.0% |
To help explain the additional standings, here are two tables that show how much of each team's optimal performance they were able to achieve. The left-most table shows the most recent week's performance. The right-most table shows the overall performance.
Best Players Available via Free Agency for Week 17
| POS | Player | PTS | | | | | | | | | | | | |
|---|---|---|---|---|---|---|---|---|---|---|---|---|---|---|
| QB | Malik Willis | 33.4 | 13.4 | 16.5 | 25.8 | 20.3 | 25.8 | 28.8 | 9.0 | 42.0 | 23.9 | 26.4 | 6.5 | 14.2 |
| WR | Luther Burden III | 28.8 | 25.3 | 11.2 | 24.1 | 11.0 | 8.8 | 9.3 | 24.8 | 7.1 | 10.3 | 26.9 | 13.2 | 10.6 |
| WR | Parker Washington | 20.0 | 21.8 | 4.6 | 17.4 | 9.8 | 0.0 | 0.0 | 5.9 | 4.9 | 5.0 | 21.5 | 11.7 | 0.7 |
| RB | Jacory Croskey-Merritt | 22.5 | 8.3 | 55.6 | 8.2 | 20.9 | 16.1 | 42.4 | 19.9 | 26.1 | 15.9 | 16.0 | 13.8 | 27.6 |
| RB | Audric Estime | 16.3 | 2.3 | 14.5 | 6.8 | 0.8 | 5.8 | 6.4 | 10.2 | 0.0 | 10.5 | 8.2 | 6.7 | 12.7 |
| TE | Jake Tonges | 15.5 | 3.4 | 11.5 | 2.6 | 0.0 | 10.0 | 11.8 | 4.8 | 6.8 | 10.7 | 0.5 | 6.9 | 18.6 |
| FLEX | Jalen McMillan | 19.9 | 7.2 | 2.6 | 11.0 | 1.0 | 5.4 | 6.2 | 3.5 | 3.6 | 4.7 | 0.9 | 10.8 | 0 |
| K | Joey Slye | 19.4 | 8.7 | 5.8 | 2.7 | 6.0 | 5.4 | 10.8 | 8.4 | 10.6 | 17.5 | 10.5 | 5.3 | 14.9 |
| DEF | Vikings | 28.0 | -4.0 | 17.0 | 8.0 | 13.0 | 6.0 | 8.0 | 0.0 | 15.0 | 11.0 | 13.0 | 13.0 | 13.0 |
Every week teams have the ability to sign new players off of waivers. The table to the left shows the highest scoring players available via waivers from the previous week.
Reading across the rows, each cell shows the number of points that the corresponding team scored and whether the free agent player would have improved the team at that position. A green square indicates the player would have offered no improvement; a red square indicates that the player would have been an improvement over the player selected.
The 2025 MIG Awards
 "Every year, MIG fan around the world wants to know which players are the best that the MIGFFL has to offer. As a former player and general manager myself who has seen a ton of Johnnie Mortons come and go, I should know. These guys you're about to meet are no Johnnie Mortons.
"On the left, you will see the players that are truly the best of the best at their position. You know this because they have the most points. I'm no math whiz like the Frinkiac over here, but I know that more is more than less. And that's just football. Of course, it should be noted that you can't score while sitting on the bench. None of these guys got points for being a benchwarmer, so these award winners earned their prize by getting out in the dirt with all the other men and rolling around until they scored. Boom!
"I don't understand the right-most column so I'll leave that to Frinky."
 "Ahem, yes, the player data we've contabulated on the right using advanced statistical measures of the most standard of deviations known to man shows those individuals that - unlike that confounded monkey, with the biting, and the scratching, and the DEAR GOD he's GOTTEN INTO THE mainframe! - Where was I, oh yes, the data you see on the right shows the individual players that showed up consistently in the scoring columns week after week. We systematically excluded players that had started in under 60% of the season's games and also those averaging less than 50% of the best player's points per game. Good glayvin, this took a lot of work."
Best MIG QB of 2025 | |||
|---|---|---|---|
 #1 Josh Allen391.3 pts | #2 | Dak Prescott 348.2 pts (23.2 ppg) | |
| #3 | Jalen Hurts 311.3 pts (19.5 ppg) | | |
| #4 | Patrick Mahomes 294.1 pts (22.6 ppg) | | |
| #5 | Justin Herbert 291.4 pts (20.8 ppg) | | |
"Mr. Consistent" MIG QB of 2025 | |||
|---|---|---|---|
 #1 Drake Maye21.09±4.1 ppg | #2 | Baker Mayfield 18.11±6.8 ppg | |
| #3 | Dak Prescott 23.21±7.6 ppg | | |
| #4 | Jalen Hurts 19.46±7.8 ppg | | |
| #5 | Patrick Mahomes 22.62±7.8 ppg | | |
Best MIG RB of 2025 | |||
|---|---|---|---|
 #1 Christian McCaffrey356.9 pts | #2 | Jonathan Taylor 354.4 pts (22.1 ppg) | |
| #3 | Bijan Robinson 345.5 pts (21.6 ppg) | | |
| #4 | Jahmyr Gibbs 324.6 pts (20.3 ppg) | | |
| #5 | De'Von Achane 294.3 pts (18.4 ppg) | | |
"Mr. Consistent" MIG RB of 2025 | |||
|---|---|---|---|
 #1 Jaylen Warren12.31±5.6 ppg | #2 | Kyren Williams 14.73±5.8 ppg | |
| #3 | Javonte Williams 12.92±6.1 ppg | | |
| #4 | Travis Etienne Jr. 14.19±7.0 ppg | | |
| #5 | Quinshon Judkins 11.4±7.1 ppg | | |
Best MIG WR of 2025 | |||
|---|---|---|---|
 #1 Puka Nacua344.5 pts | #2 | Jaxon Smith-Njigba 344.0 pts (21.5 ppg) | |
| #3 | Ja'Marr Chase 276.5 pts (18.4 ppg) | | |
| #4 | Amon-Ra St. Brown 258.9 pts (17.3 ppg) | | |
| #5 | George Pickens 258.7 pts (17.2 ppg) | | |
"Mr. Consistent" MIG WR of 2025 | |||
|---|---|---|---|
 #1 DK Metcalf10.95±6.6 ppg | #2 | Jaylen Waddle 10.45±6.7 ppg | |
| #3 | Davante Adams 14.14±6.9 ppg | | |
| #4 | Nico Collins 13.71±7.0 ppg | | |
| #5 | Zay Flowers 11.51±7.3 ppg | | |
Best MIG TE of 2025 | |||
|---|---|---|---|
 #1 Trey McBride257.9 pts | #2 | Brock Bowers 154.2 pts (12.8 ppg) | |
| #3 | Kyle Pitts Sr. 139.9 pts (11.7 ppg) | | |
| #4 | George Kittle 132.6 pts (13.3 ppg) | | |
| #5 | Travis Kelce 120.0 pts (9.2 ppg) | | |
"Mr. Consistent" MIG TE of 2025 | |||||
|---|---|---|---|---|---|
 #1 Travis Kelce9.23±5.7 ppg | #2 | Trey McBride 16.12±9.0 ppg | | ||
| #3 | Brock Bowers 12.85±10.5 ppg | | |||
| #4 | Kyle Pitts Sr. 11.66±13.0 ppg | | |||
Best MIG K of 2025 | |||
|---|---|---|---|
 #1 Brandon Aubrey189.8 pts | #2 | Cameron Dicker 176.5 pts (11.0 ppg) | |
| #3 | Chase McLaughlin 153.3 pts (9.6 ppg) | | |
| #4 | Tyler Loop 137.7 pts (8.6 ppg) | | |
| #5 | Jake Bates 127.4 pts (9.1 ppg) | | |
"Mr. Consistent" MIG K of 2025 | |||
|---|---|---|---|
 #1 Matt Prater7.83±3.8 ppg | #2 | Tyler Loop 8.61±3.9 ppg | |
| #3 | Jake Bates 9.1±4.2 ppg | | |
| #4 | Chris Boswell 7.86±4.3 ppg | | |
| #5 | Evan McPherson 7.56±4.6 ppg | | |
Best MIG DEF of 2025 | |||
|---|---|---|---|
 #1 Los Angeles249.0 pts | #2 | Seattle 147.0 pts (13.4 ppg) | |
| #3 | Green Bay 117.0 pts (7.8 ppg) | | |
| #4 | Baltimore 112.0 pts (11.2 ppg) | | |
| #5 | Houston 104.0 pts (13.0 ppg) | | |
"Mr. Consistent" MIG DEF of 2025 | |||||
|---|---|---|---|---|---|
 #1 Kansas City8.73±5.7 ppg | #2 | Los Angeles 11.86±6.7 ppg | | ||
| #3 | Green Bay 7.8±7.4 ppg | | |||
| #4 | Seattle 13.36±11.6 ppg | | |||
"Let's be real folks, this game ain't about the Johnnies and Joes, it's about their exes and hoes. Heh heh heh, just kidding, folks. Matty had to make a little joke there. It's a team game! While the swarthy men do the pounding on the field, the general managers and team owners beat 'em all off in the board room. Double boom!"In the MIGFFL, we have two phases. First, you draft your team. That's where the foundation is set for the season to come. Then you have the cleanup phase, where you replace the duds with new hot studs through waivers. That's what I like. Frinky?"
"Using the Frinkiac 3000, an amazing device despite its clear lack of flubber, I have been able to determine the exact number of MIG points that a team has derived from its drafted players. Applying the subtraction matrix, we also can accurately determine the number of MIG team points that came from free agent and waiver claims."Below you will see two tables. The one on the left ranks the teams based on drafted points they have amassed, while the one on the right shows the points gained from transactions made in-season. Oh for glayvin out loud, that monkey is picking tranSIStors off the motherboard and EATING THEM! Stay calm, Frinky. Ahem, please excuse me while I apply the monkey-deterrent spray which has a core ingredient of... LOVE?!? Who has been screwing with this thing? Darn you, Mr. Professional Football Mayvin!"
| # | Team | Drafted PTS | Total PTS | % drafted PTS | |
|---|---|---|---|---|---|
| 1 | |
Office Linebackers | 1585.6 | 2008.2 | 79.0% |
| 2 | |
Portland Pat Tillman | 1534.0 | 1922.0 | 79.8% |
| 3 | |
Seattle Lawful Evils | 1494.8 | 1845.4 | 81.0% |
| 4 | |
Honolulu Blew It | 1488.2 | 1986.8 | 74.9% |
| 5 | |
Team Harleton | 1487.8 | 2026.4 | 73.4% |
| 6 | |
NY WH Coons | 1432.7 | 1841.4 | 77.8% |
| 7 | |
Palestinian Chicken | 1405.8 | 1739.1 | 80.8% |
| 8 | |
Vulcan Mind-melds | 1326.9 | 2023.3 | 65.6% |
| 9 | |
Springfield Isotopes | 1308.2 | 2087.8 | 62.7% |
| 10 | |
DCFC | 1248.9 | 1755.8 | 71.1% |
| 11 | |
OK City Bombers | 1021.4 | 1749.9 | 58.4% |
| 12 | |
51st Statesmen | 973.9 | 1593.8 | 61.1% |
| # | Team | Waiver PTS | Total PTS | % waiver PTS | |
|---|---|---|---|---|---|
| 1 | |
Springfield Isotopes | 779.6 | 2087.8 | 37.3% |
| 2 | |
OK City Bombers | 728.4 | 1749.9 | 41.6% |
| 3 | |
Vulcan Mind-melds | 696.4 | 2023.3 | 34.4% |
| 4 | |
51st Statesmen | 620.0 | 1593.8 | 38.9% |
| 5 | |
Team Harleton | 538.5 | 2026.4 | 26.6% |
| 6 | |
DCFC | 506.9 | 1755.8 | 28.9% |
| 7 | |
Honolulu Blew It | 498.6 | 1986.8 | 25.1% |
| 8 | |
Office Linebackers | 422.6 | 2008.2 | 21.0% |
| 9 | |
NY WH Coons | 408.7 | 1841.4 | 22.2% |
| 10 | |
Portland Pat Tillman | 388.0 | 1922.0 | 20.2% |
| 11 | |
Seattle Lawful Evils | 350.6 | 1845.4 | 19.0% |
| 12 | |
Palestinian Chicken | 333.3 | 1739.1 | 19.2% |